Debugging using Kdevelop
From Yade
Update for Kdevelop 4
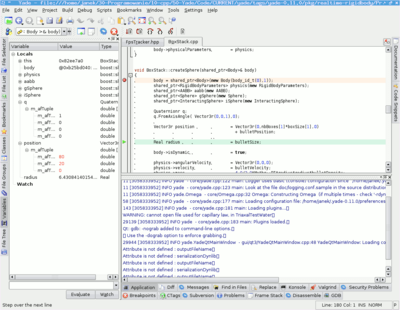
Debugging with kdevelop4 is quite easy using the "attach process" option.
1. Start yade in a separate terminal (make sure it is compiled with debug symbols)
2. Find "attach process" in the Run menu, and browse running processes : you'll find yade with a small "X" icon. Select it and validate, this will freeze yade temporary.
3. Now add breakpoints in yade code by right-clicking in the left margin of source files.
4. Click the "continue" button to unfreeze yade and do what you like (from python console or QtGui).
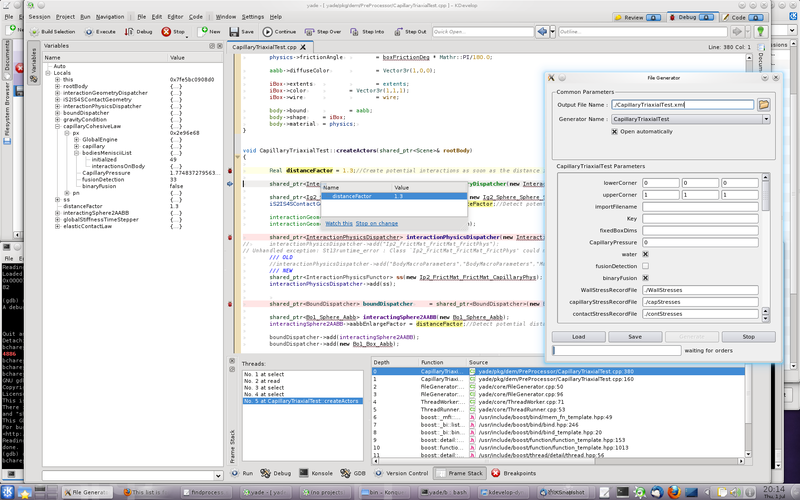
5. The debugger will freeze yade again as soon as a breakpoint is reached, and move back to kdevelp. It will let you inspect values, execute line by line, etc. Click "continue" again to quit debugging and run yade until the next breakpoint. The example below is debugging a pre-processor.
Procedure for Kdevelop 3
When compiling yade for the first time, please do it from command line, so that a file scons.config will contain your compilation settings. After that you can start working using kdevelop. You can run kdevelop with command:
cd yade-0.11.0
kdevelop Yade.kdevelop
Or running it directly from konqueror by clicking on file Yade.kdevelop. When kdvelop starts for the first time it will ask to populate the project. Let it do this:
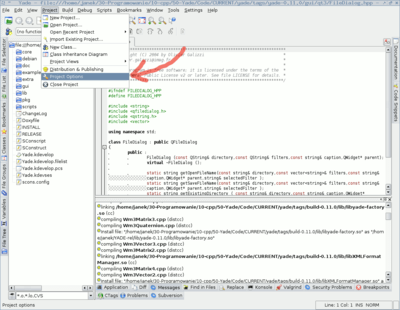
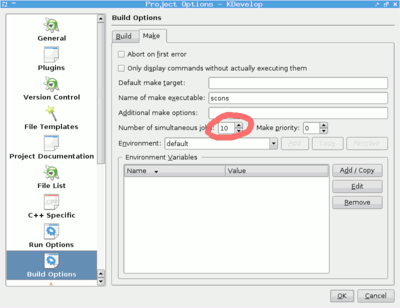
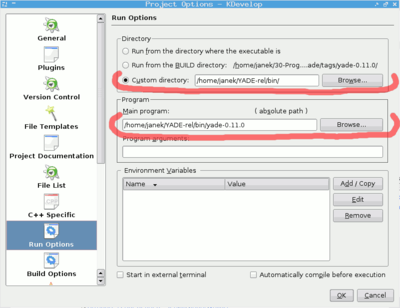
Then you will need to go into project options to configure your paths and set number of processors to be used during compilation (because, unfortunately kdevelop overrides scons jobs setting):
Then, after compiling yade you can try running it, and debugging, which should work without problems.
