Debugging using Kdevelop
From Yade
Procedure for Kdevelop 4
(Click on images to enlarge them to readable size)
Using "attach"
Debugging with kdevelop4 is quite easy using the "attach process" option. Other debugging methods where kdev4 would start the executable alone are not supported because kdev4 doesn't consider python executables. Also note that attaching yade while the Qt controller is not active will most probably not allow you to stop on breakpoints.
1. Start yade in a separate terminal (make sure it is compiled with debug symbols)
2. Find "attach process" in the Run menu of kdevelop4, and browse running processes : you'll find yade with a small "X" icon. Select it and validate, this will freeze yade temporary (if Qt is not open there will be a console application icon, as discussed above it is not suited for debugging).
3. Now add breakpoints in yade code by right-clicking in the left margin of source files.
4. Click the "continue" button to unfreeze yade and do what you like (from python console or QtGui).
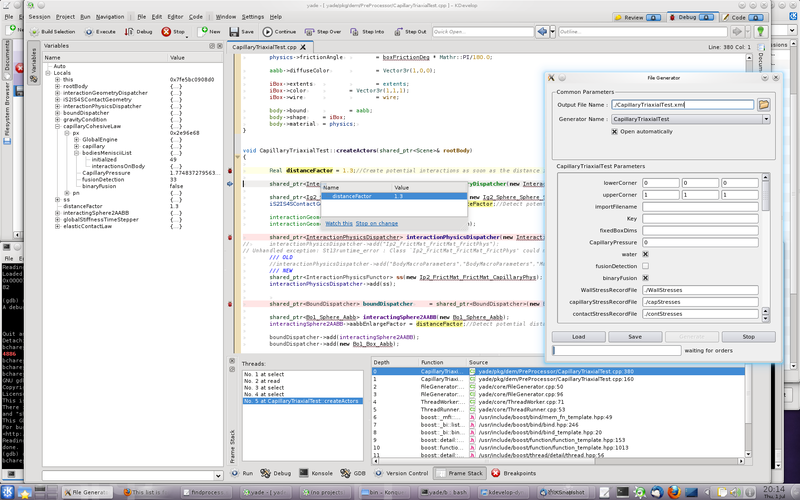
5. The debugger will freeze yade again as soon as a breakpoint is reached, and move back to kdevelp. It will let you inspect values, execute line by line, etc. Click "continue" again to quit debugging and run yade until the next breakpoint. The example below is debugging a pre-processor.
Starting debug session from inside kdevelop
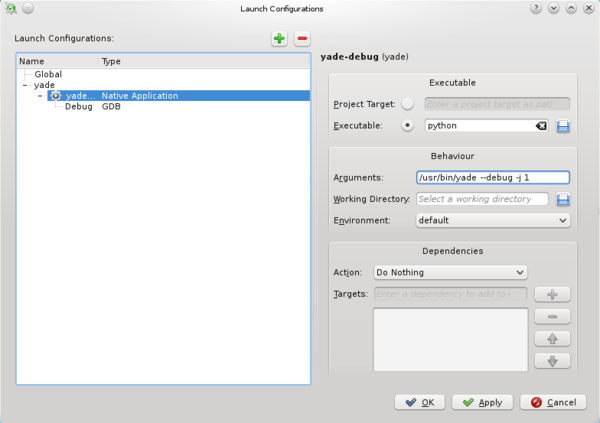
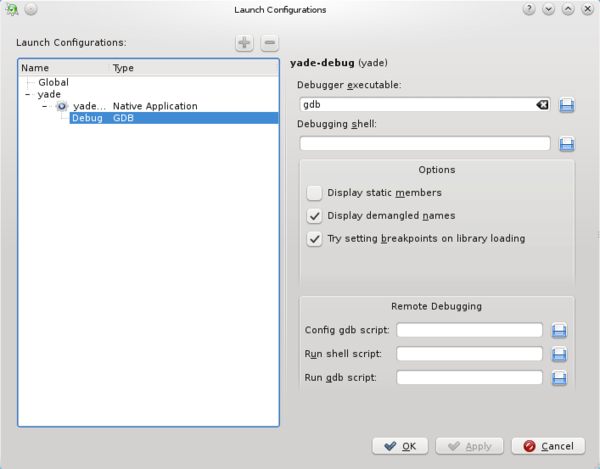
Alternatively, it is possible to start yade from inside kedevelop by configuring a debug launch. It that case, yade is attached automaticaly as soon as it starts. The behaviour is the same as the one described above. The launch configuration is given in the snapshots below.
It is possible to start with a specific script by appending the target script in arguments (after "/usr/bin/yade --debug"). Note that the full path (e.g. /home/username/.../yade-dir/bin/yade-bzr-revno) must be provided for yade executable (and script eventually).


