Difference between revisions of "Performance Test"
From Yade
(→Test 2) |
|||
| (3 intermediate revisions by the same user not shown) | |||
| Line 63: | Line 63: | ||
== Test 2 == |
== Test 2 == |
||
| − | Same as Test 1 but with more iterations (1x, 3x and 12x the number of iterations specified in checkPerf.py) and more particles (up to |
+ | Same as Test 1 but with more iterations (1x, 3x and 12x the number of iterations specified in checkPerf.py) and more particles (up to 1 million). However, 3 simulations per data point only. A summary of the full series of results can be downloaded here [https://yade-dem.org/w/images/c/c1/Summary.pdf]. All relevant data files and timing stats can be downloaded here [https://yade-dem.org/w/images/d/d3/PerformanceTest.tar.gz]. |
=== Performance of Parallel Collider === |
=== Performance of Parallel Collider === |
||
| Line 94: | Line 94: | ||
| [[File:Table_v1_iter12.png|600px|thumb|center]] |
| [[File:Table_v1_iter12.png|600px|thumb|center]] |
||
| [[File:Table_v2_iter12.png|600px|thumb|center]] |
| [[File:Table_v2_iter12.png|600px|thumb|center]] |
||
| + | |} |
||
| + | </div></center> |
||
| + | |||
| + | And here a summary of the scaling of the new parallel collider for 1 million particles for different threads. The scaling factor is calculated by dividing the absolute time of the InsertionSortCollider for j1 by the absolute time of the InsertionSortCollider for j>1. The timings are taken from the last simulation of base iterations x12 (iterx12). The collider is called 46 times. For full timing stats see files in [https://yade-dem.org/w/images/d/d3/PerformanceTest.tar.gz]. |
||
| + | |||
| + | <center><div> |
||
| + | {|class="wikitable" border="1" cellpadding="4" cellspacing="4" |
||
| + | ! Threads j |
||
| + | | 2 |
||
| + | | 4 |
||
| + | | 6 |
||
| + | | 8 |
||
| + | | 10 |
||
| + | | 12 |
||
| + | | 14 |
||
| + | | 16 |
||
| + | |- |
||
| + | !Scaling Tcoll(j1)/Tcoll(j) |
||
| + | | 1.90 |
||
| + | | 2.95 |
||
| + | | 3.75 |
||
| + | | 4.82 |
||
| + | | 5.18 |
||
| + | | 5.75 |
||
| + | | 6.42 |
||
| + | | 6.30 |
||
|} |
|} |
||
</div></center> |
</div></center> |
||
Latest revision as of 01:14, 10 April 2014
Introduction
This page summarises some results for the performance test of YADE (yade --performance) on multicore machines. It should give an idea on how good YADE scales.
Test 1
Two versions of YADE are compared to each other and two different machines are used. The test was conducted on the computing grid of the University of Newcastle by Klaus.
YADE versions:
- version1 (trunk): 2014-01-25.git-22c2441
- version2 (see https://lists.launchpad.net/yade-dev/msg10498.html): 2014-02-24.git-b60d388
Machines:
- AMD: AMD Opteron(tm) Processor 6282 SE (64 cores)
- Intel: Intel(R) Xeon(R) CPU E5-2670 0 @ 2.60GHz (16 cores)
System:
- Red Hat Enterprise Linux Server release 6.4 (Santiago)
- gcc version 4.4.7 20120313 (Red Hat 4.4.7-3) (GCC)
Other:
- Number of tests per data point in plots: 10
Performance of Parallel Collider
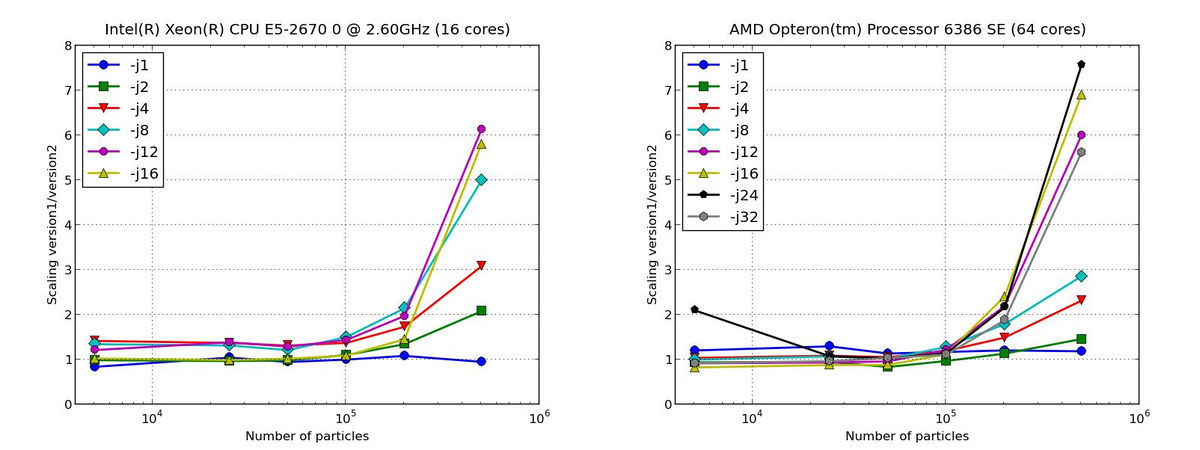
Fig. 1.1 shows how version2 (parallel collider) scales in relation to version1 (NOTE: version1/version2 indicates how much faster the parallel collider is). It is interesting to note that for simulations with less than 100000 particles the scaling is almost not depending on the number of threads and scaling is slightly bigger than one only. For simulations with more than 100000 particles things are looking differently.
Using the total number of cores on the machine is not recommended, e.g. -j12 (and probably -j14) scales better than -j16 on the Intel and -j24 scales better than -j32 on the AMD.
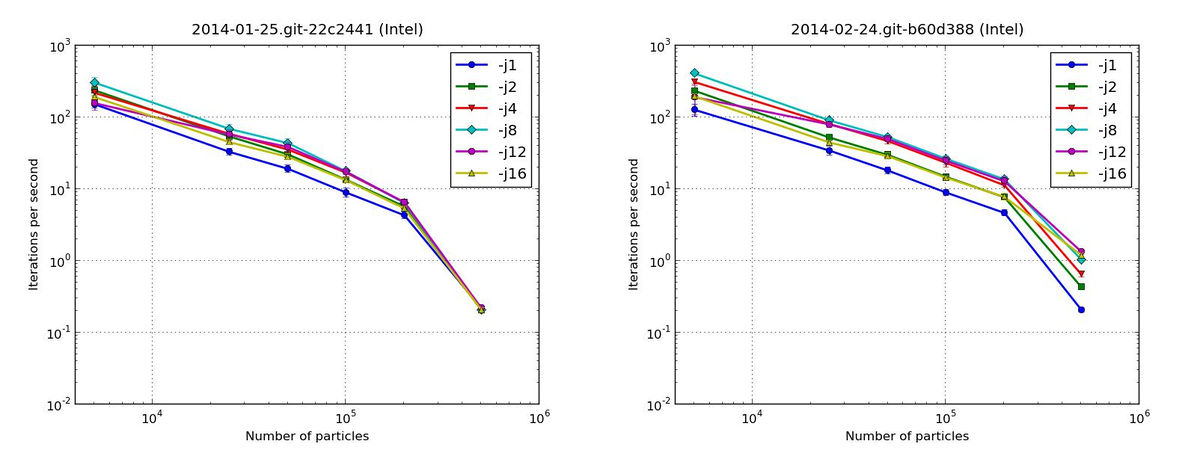
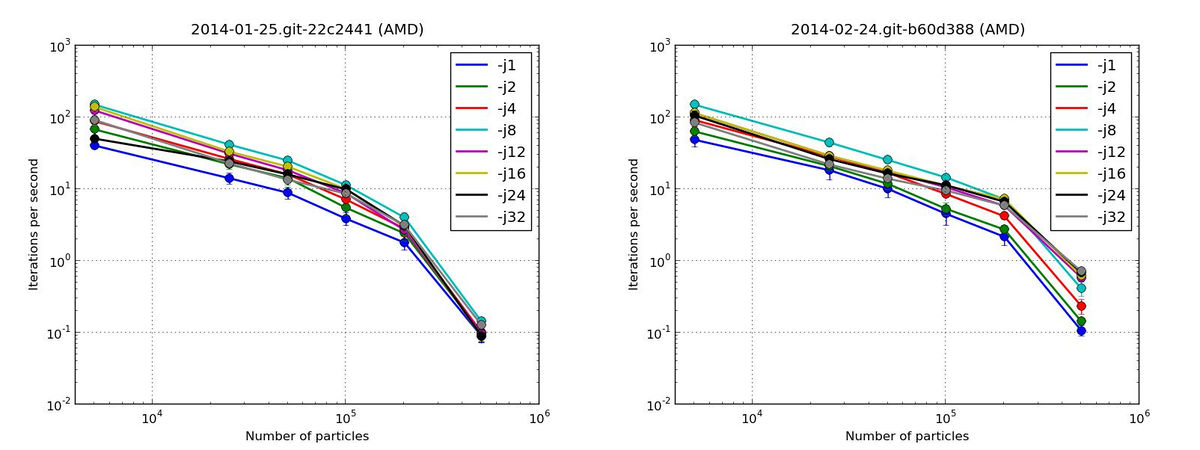
Figs. 1.2-1.3 show the absolute speed in iterations per seconds for both versions on both machines. It can clearly be seen that the lines for the parallel collider on the right are almost shifted parallel whereas the lines for version1 converge at the 500000 particle point. This means that the parallel collider does not just allow for better scaling (i.e. faster calculation) but as well for more particle to be used in a simulation.
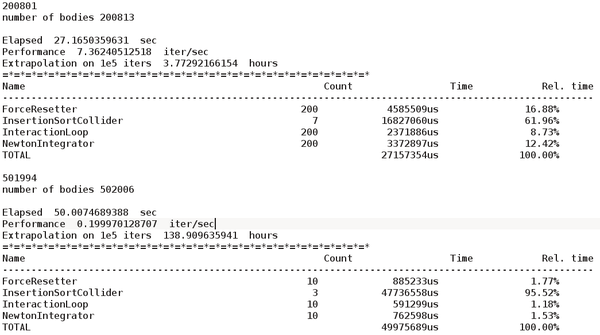
Sample output from Timing
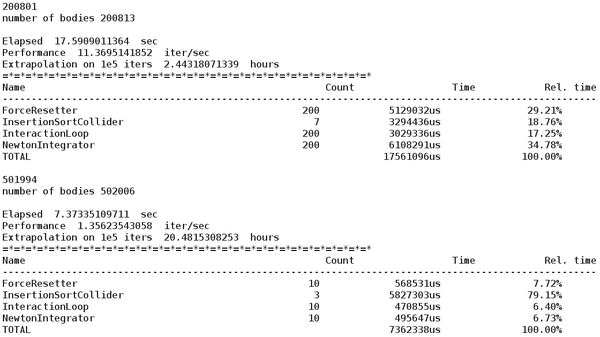
Sample output for timing for -j12 on Intel:
Comparison AMD/Intel
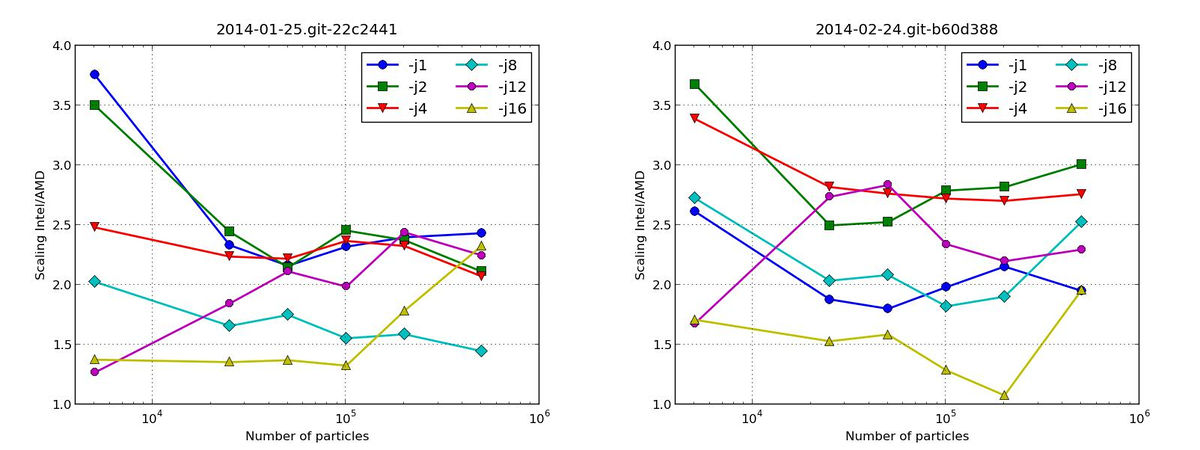
Fig. 1.4 shows the difference between running version1 and version2 on an Intel or AMD machine. The AMD is generally slower (Intel/AMD>1).
Conclusions
The new parallel collider scales good for the --performance test with more than 100000 particles. The scaling for 500000 particles is really good, i.e. -j12 scales by a factor of 6 for both machines. Intel machines perform better (similar observations have been made here [1]). Finally, I would say that there is an optimum number of threads you should use per simulation. Many cores doesn't always mean much faster. So use your resources wisely.
Finally, it should be mentioned that the results for 500000 particles are extrapolated from 10 iterations since this is the value in the current script. This is far too optimistic. I will post more realistic results soon.
Test 2
Same as Test 1 but with more iterations (1x, 3x and 12x the number of iterations specified in checkPerf.py) and more particles (up to 1 million). However, 3 simulations per data point only. A summary of the full series of results can be downloaded here [2]. All relevant data files and timing stats can be downloaded here [3].
Performance of Parallel Collider
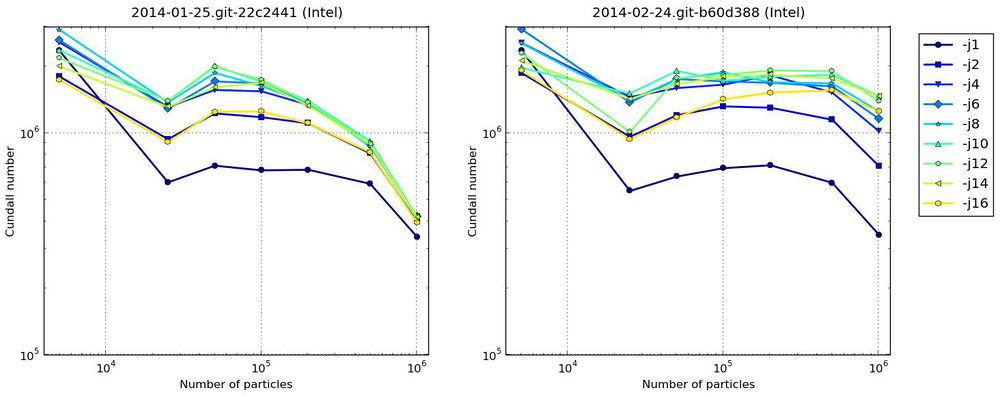
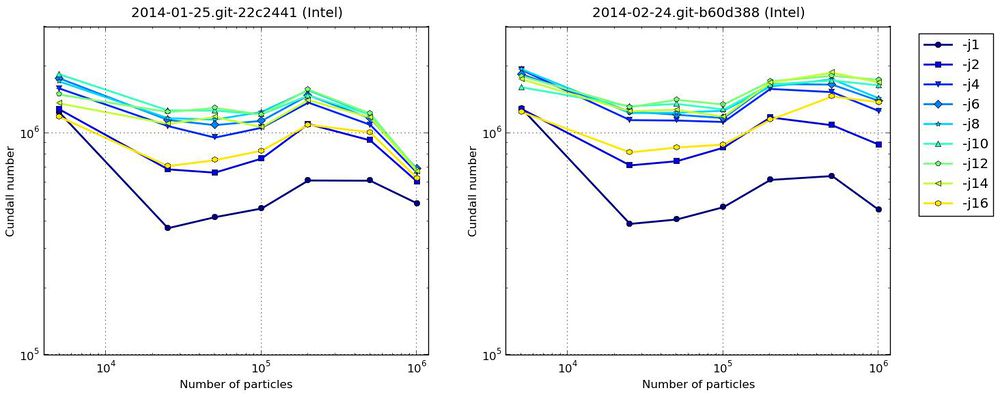
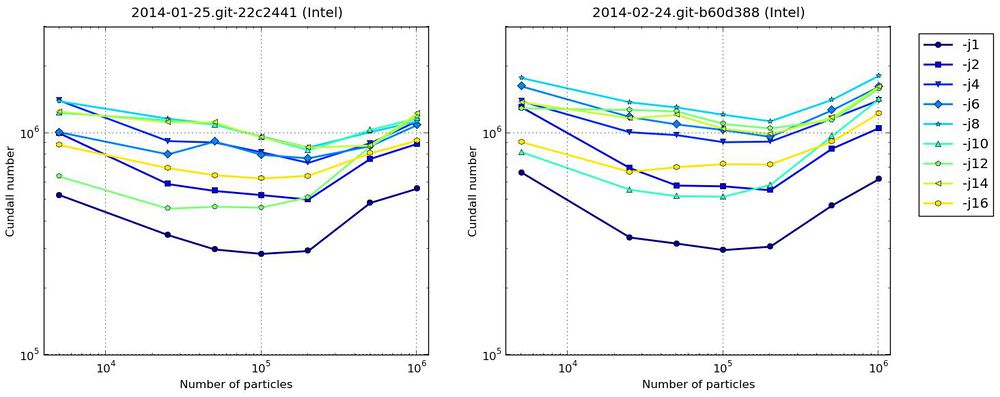
The following figures show the cundall number for both versions. It can be seen that the estimated scaling gets worst when increasing the number of iterations. Nevertheless, the graphs show a more stable Cundall number for the new implementation with the parllel collider.
Some output from Timing
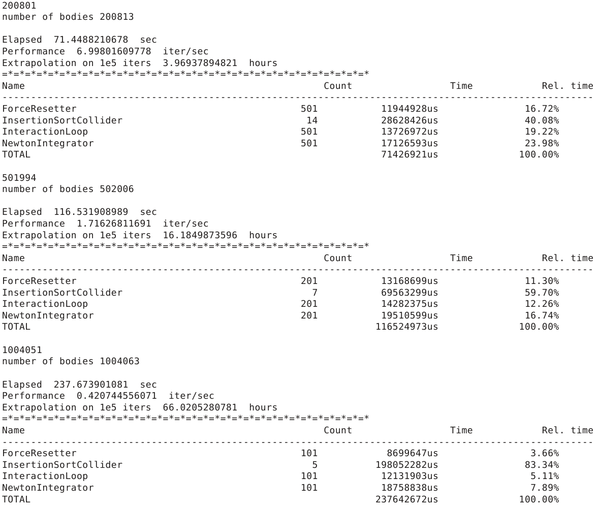
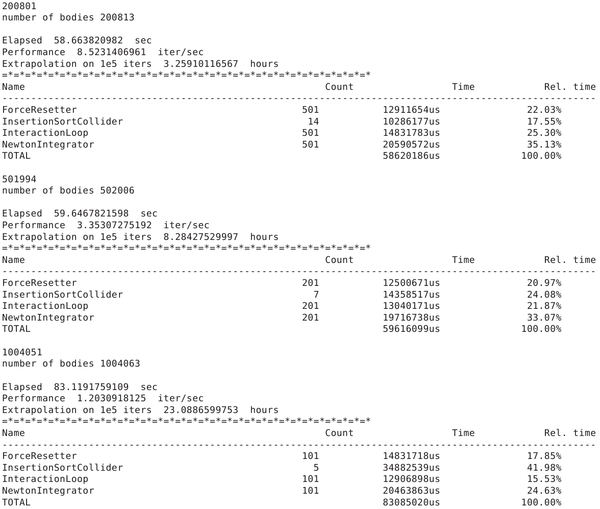
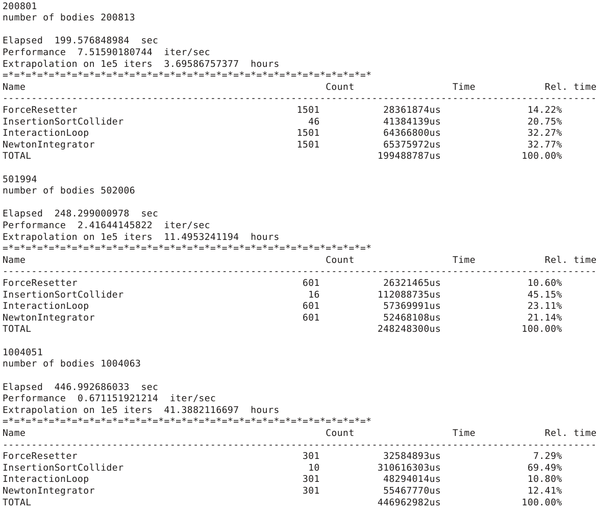
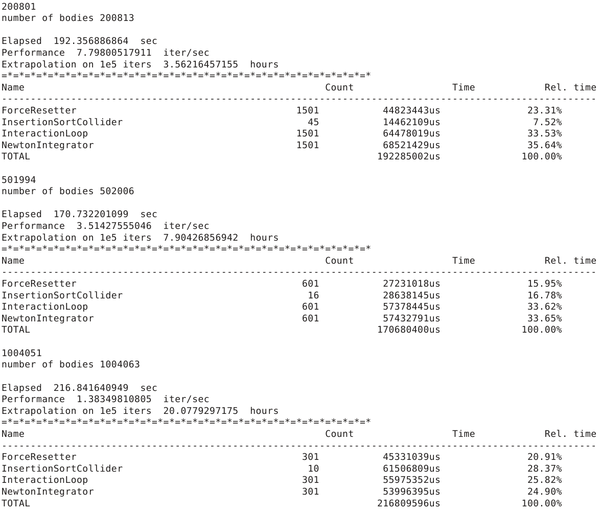
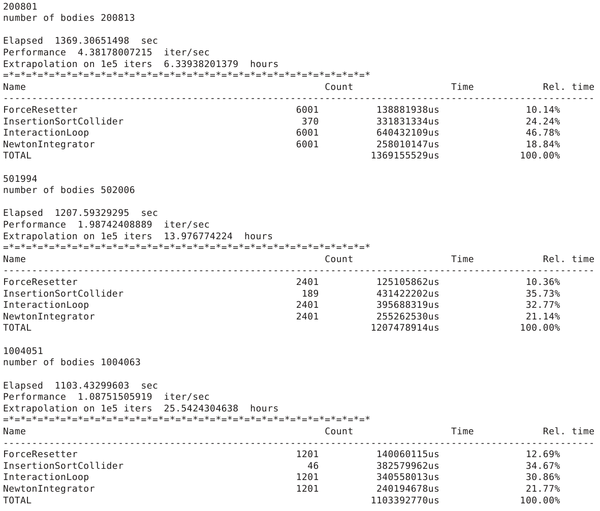
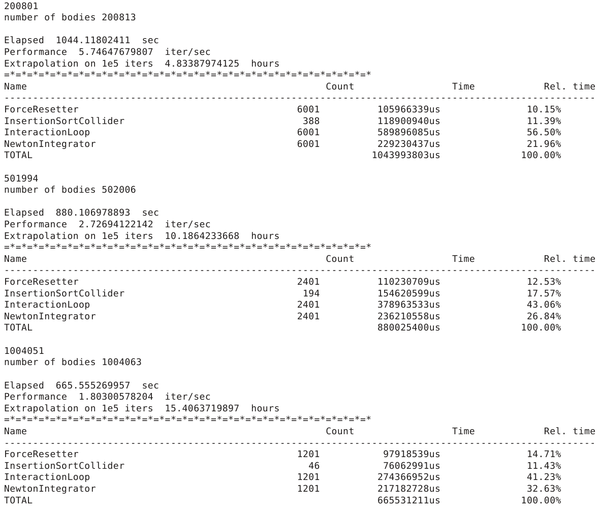
Timing output for -j8 on Intel for various iterations (1x, 3x and 12x the number of iterations specified in checkPerf.py):
And here a summary of the scaling of the new parallel collider for 1 million particles for different threads. The scaling factor is calculated by dividing the absolute time of the InsertionSortCollider for j1 by the absolute time of the InsertionSortCollider for j>1. The timings are taken from the last simulation of base iterations x12 (iterx12). The collider is called 46 times. For full timing stats see files in [4].
| Threads j | 2 | 4 | 6 | 8 | 10 | 12 | 14 | 16 |
|---|---|---|---|---|---|---|---|---|
| Scaling Tcoll(j1)/Tcoll(j) | 1.90 | 2.95 | 3.75 | 4.82 | 5.18 | 5.75 | 6.42 | 6.30 |
Conclusions
Results indicate again that there is an optimum number of threads. It might be best to try a couple of configurations first since it will certainly be problem dependent.
The timing stats suggest that InteractionLoop and NewtonIntegrator are becoming the bottle neck now.
Test 3
TODO some more real example, feel free to add something...
